Since transportation volumes and logistics activity are directly related to economic activity, particularly retail trade and manufacturing volumes, a quick review of both are warranted given the recent trends in freight volumes. Despite decreased rail, truck, and air volumes since the start of 2019, the economy has continued to grow although at modest levels. Much of this growth can be attributed to continued consumer spending and low unemployment. However, the manufacturing sector is beginning to also send warning signals of a possible recession that have already impacted transportation volumes and could impact consumer spending in 2020.
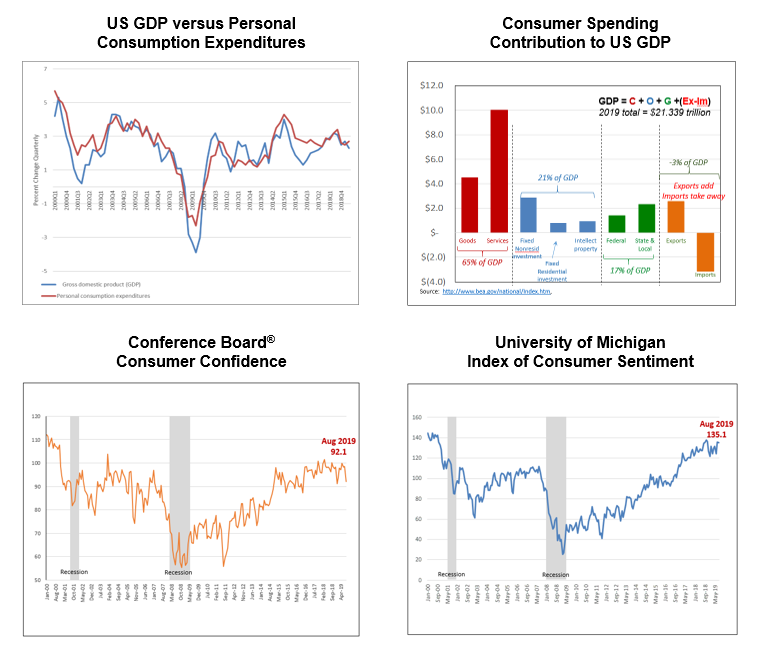
Personal consumption expenditures, or the value of goods and services purchased by consumers, has been increasing at a rate of between 1.5 and 1.6 percent (energy and food excluded) during the second and third quarters of this year. The level of personal consumption expenditures (PCE) provides a very early signal of what we can expect for overall economic activity in the United States. GDP and PCE are highly correlated as demonstrated in comparison plot of the quarterly percent change in each since January 2000 (upper left chart).
Much of the relationship can be explained by the large contribution of consumer spending to GDP. The upper right chart indicates that for the first two quarters of 2019, consumer spending on goods and services represented 65 percent of US GDP. For the last several years, consumer spending has been fluctuated near 70 percent.
When consumers tighten spending, the US economy frequently dips into a recessionary period. This situation especially happens when consumers lack confidence in the economy and begin to “tighten their belts” in anticipation of potential layoffs, pay-cuts, or fewer hours. The two charts showing consumer confidence and consumer sentiment reflect how drops in consumer confidence have also preceded recessionary periods. Currently, consumer confidence and sentiment remain relatively high due to low unemployment, but changes in manufacturing activity could lead to layoffs and a drop-in confidence leading to reduced consumer expenditures.
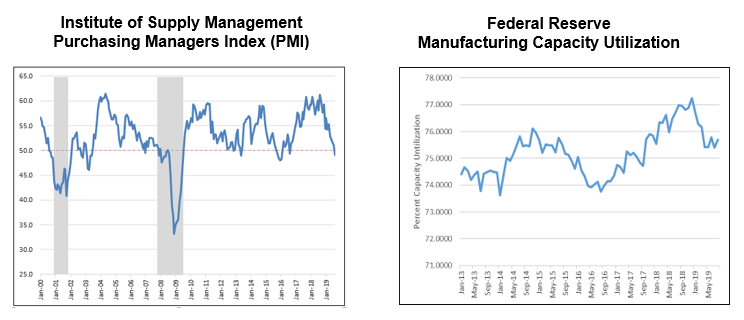
Manufacturing and upstream supply chain activity in the United States appears to be slowing. The Purchasing Managers Index (PMI) fell below 50 (see chart on left above) for the first time since 2016, when the manufacturing sector went into a slight recession. Values below 50 are associated with contraction in manufacturing activity while values above 50 signal growth. Many analysts are taking note of the recent report since PMI has been showing a downward trend since late 2018. When the PMI drops, so do orders for raw materials and spare parts which directly impacts transportation volumes. The drop in the PMI is also reflected in a decreased level in manufacturing capacity utilization (chart above right) further signaling a slowing or reduced level of manufacturing activity.
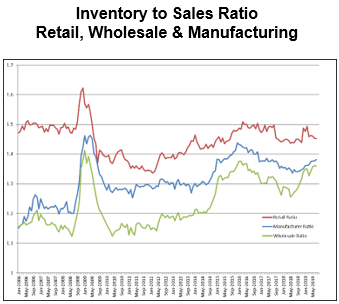
Another indicator of economic activity and a leading indicator of transportation volumes is the inventory-to-sales ratio (chart on left).
When inventories increase faster than sales, fewer orders are placed until these inventories are sold off or consumed. Recent trends in the inventory-to-sales ratio show inventories increasing at the wholesale and manufacturing levels and remaining relatively stable at the retail levels. Retailers continue to “push inventory back” in the supply chain requiring their suppliers to hold this inventory and replenish more frequently and in smaller volumes. The current scenario favors LTL carriers and would suggests softer TL demand.
The signals from the manufacturing sector need to be carefully watched. Reduced manufacturing and purchasing levels have already resulted in lower transportation volumes across multiple modes. Considerable uncertainty exists whether the trends in manufacturing will continue leading to a further pull-back in production which could lead to increased unemployment, lower economic growth, and even further softening in the transportation market.
Sources: Data used in this report has been compiled over time from periodic reports produced by the Bureau of Economic Analysis, American Association of Railroads, the Conference Board, the University of Michigan, the Institute of Supply Management and the Federal Reserve.
UPDATE 10.03.19
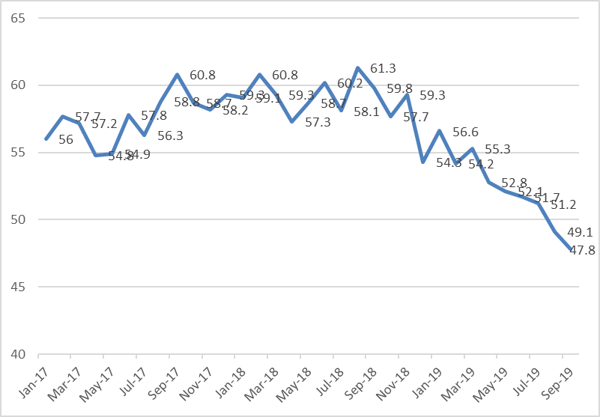
Yesterday, the Dow Jones and S&P both fell over one percent with the release of the September purchasing managers index (PMI). As of 1:00 CDT, the Dow is down another 2%. For the second month in a row, the PMI fell below .50, the benchmark for whether manufacturing activity is expanding (>.50) or contracting (<.50). Two months below .50 does not necessarily indicate a trend; however, the PMI has been on a downward trend since mid-2018.
The downward trend in the PMI tracks closely with what has been experienced in rail volumes. All commodities moved by rail are down year-to-date except for petroleum and petroleum products. In the weekly American Association of Railroads (AAR) report on rail car volumes, total rail car traffic is down 7.4% for the year with intermodal also down 6.9%.
You can obtain the ISM report at https://www.instituteforsupplymanagement.org/ismreport/mfgrob.cfm?SSO=1
The AAR weekly railcar report is available at https://www.aar.org/aar_news/weekly-rail-traffic-data/
Authored by Dr. Terrance Pohlen.
Terrance (Terry) Pohlen, PhD, is a professor of logistics and the Senior Associate Dean, College of Business, University of North Texas. He is the founding Director of the Jim McNatt Institute for Logistics Research and served for twelve years as the Director of the Center for Logistics Education and Research at UNT.